PT100 Table and RTD Calculator
Convert between temperature and resistance for Pt100 and Pt1000 sensors, see the tolerance class band, and print a table.
The PT100 table is a free, browser-based tool that converts between temperature and resistance for platinum RTD sensors. Enter a temperature in °C or °F to get the resistance, or enter a resistance to get the temperature. It also builds a full table from −200 to 850 °C, so it works as an RTD PT100 table, a PT100 resistance table, or a PT100 resistance chart. It supports Pt100, Pt500 and Pt1000 sensors, shows the IEC 60751 tolerance band and a curve, and runs entirely in your browser with no sign-up. It also works on a phone.
It covers Pt100, Pt500 and Pt1000 sensors from −200 to 850 °C.
How to use the PT100 table
- Choose the mode: temperature to resistance, or resistance to temperature.
- Select the sensor type: Pt100 (100 Ω at 0 °C), Pt500 (500 Ω) or Pt1000 (1000 Ω).
- Pick the unit you are working in, °C or °F.
- Type your value into the input box. The results update as you type, so there is no separate calculate step.
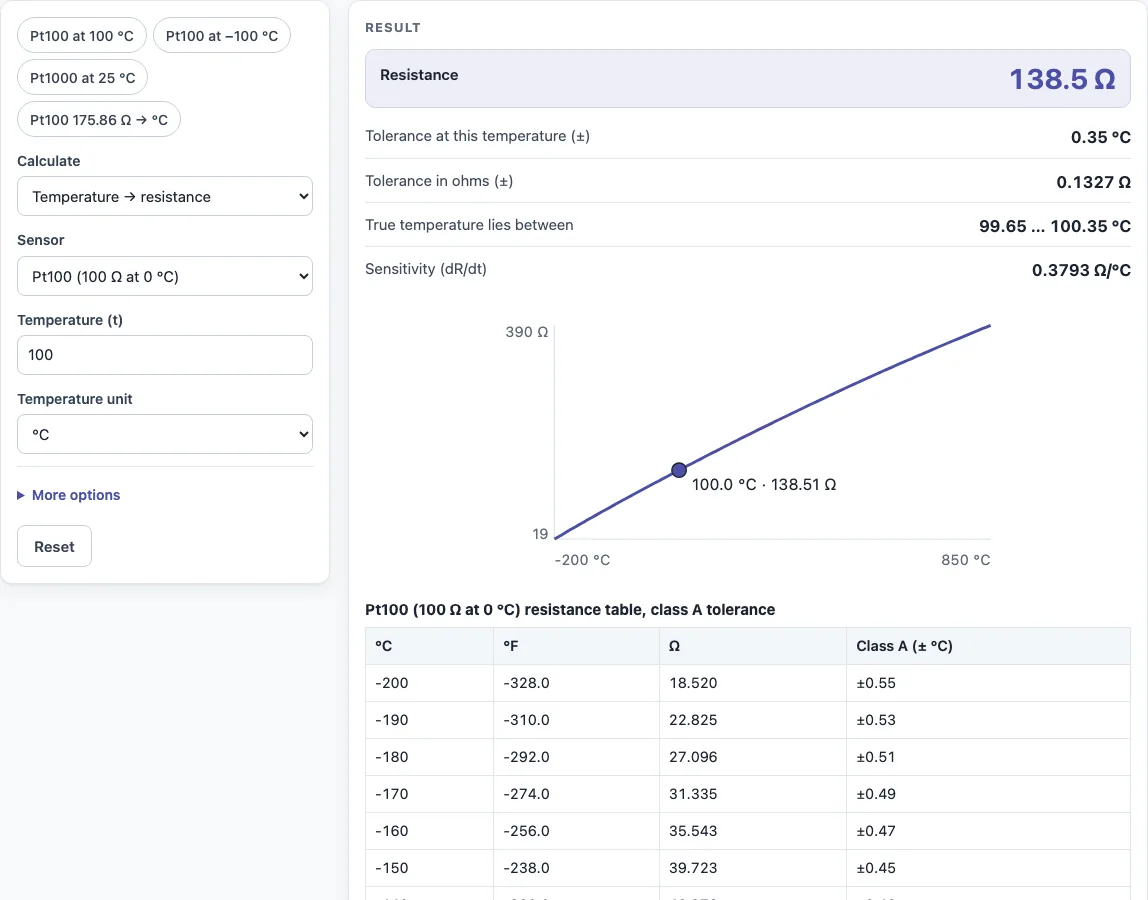
- Read the result, then check the tolerance band. It shows the allowed error in °C and in ohms, along with the sensitivity in Ω per °C at that temperature.
- Open the calculation details to see the formula and each step with your numbers.
- Set the table range and step (1, 5, 10 or 50 °C) to list values across the full range, and use the curve drawing to view the shape of the relationship.
Use Copy result to copy the result lines with a link, or Copy link to copy the page address. The address stores every input, so opening it later restores the same calculation. Print / save as PDF prints the inputs, results, calculation steps and the date.
The presets show a Pt100 at 100 °C and at −100 °C, a Pt1000 at 25 °C and 175.86 Ω converted back to temperature. Set the table step to 1, 5, 10 or 50 °C and the range you need, then print the table with Print / save as PDF.
What is the resistance of a PT100 at 0 °C and 100 °C?
A Pt100 has a nominal resistance of 100.000 Ω at 0 °C; that is what the 100 in the name means. At 100 °C it reads 138.506 Ω, which is the most common reference point people check when they build a table.
How do you convert PT100 resistance to temperature?
Above 0 °C, you solve the quadratic form of the IEC equation for t, which gives an exact answer. Below 0 °C, the cubic term makes this impossible to solve directly, so the calculator uses iteration to find the temperature. For example, a Pt100 reading of 175.86 Ω corresponds to 200.01 °C.
What is the Callendar–Van Dusen equation?
It is the standard equation in IEC 60751 that relates RTD resistance to temperature. Above 0 °C it is R(t) = R0 (1 + A t + B t²), with A = 3.9083 × 10⁻³ and B = −5.775 × 10⁻⁷. Below 0 °C a third term, C (t − 100) t³, is added, with C = −4.183 × 10⁻¹². R0 is the resistance at 0 °C, so for a Pt100 it is 100 Ω.
What is the difference between PT100 and PT1000?
Both are platinum RTDs that follow the same equation. The difference is R0: a Pt100 has 100 Ω at 0 °C, while a Pt1000 has 1000 Ω. Because every value scales with R0, a Pt1000 reads ten times the resistance of a Pt100 at the same temperature. At 25 °C, a Pt1000 reads about 1097.35 Ω.
What is PT100 class A and class B tolerance?
Class A and class B are tolerance classes in IEC 60751. Class A allows ±(0.15 + 0.002 |t|) °C, so about ±0.15 °C at 0 °C. Class B allows ±(0.3 + 0.005 |t|) °C, about ±0.3 °C at 0 °C. The allowed error grows with temperature, so at 100 °C the bands are about ±0.35 °C for class A and ±0.8 °C for class B.
Why use a 3-wire or 4-wire RTD?
In a 2-wire connection, the resistance of the lead wires adds to the reading, which causes an error that grows with cable length. A 3-wire or 4-wire connection compensates for this lead resistance. A 4-wire connection is the most accurate of the three because it separates the current path from the voltage measurement.
Sources
Checked October 2026:
- Fluke Pt100 table generator: IEC 60751 Callendar–Van Dusen coefficients A = 3.9083 × 10⁻³, B = −5.775 × 10⁻⁷, C = −4.183 × 10⁻¹²
- KP-AS Pt100 resistance table (all 106 points match to 0.005 Ω)
- Lapp, Pt100 accuracy classes: class tolerances and their temperature ranges
- Pt500 and Pt1000 use the same equation scaled by R0
For estimation; verify critical designs against the applicable standard.
Worked examples
| Input | Result |
|---|---|
| Pt100 (100 Ω at 0 °C) at 100 °C | 138.506 Ω |
| Pt100 (100 Ω at 0 °C) at -100 °C | 60.256 Ω |
| Pt1000 (1000 Ω at 0 °C) at 25 °C | 1097.347 Ω |
| Pt100 (100 Ω at 0 °C), 175.86 Ω | 200.01 °C |
| Pt100 (100 Ω at 0 °C) at 212 °F | 138.506 Ω |
Calculated by the tool above with these values.
Frequently asked questions
Is the PT100 table free to use?
Yes. It runs in your browser with no sign-up, and nothing you enter is uploaded.
Can I use the results in commercial work?
Yes. You can use the results in designs, quotes, documentation and reports without attribution.
Can I use a Pt500 or Pt1000 instead of a Pt100?
Yes. Select Pt500 (500 Ω at 0 °C) or Pt1000 (1000 Ω at 0 °C) as the sensor type, and the same equation is applied with that R0.
Does the table work on a phone?
Yes. The tool works on phones as well as desktop browsers.
What is the resistance of a PT1000 at 0 °C?
Exactly 1000 Ω. Every value is ten times the Pt100 value at the same temperature.
How much does a PT100 change per degree?
About 0.385 Ω per °C on average between 0 and 100 °C (38.5 Ω over 100 °C). The tool shows the exact sensitivity at your temperature.
Can I enter the temperature in °F?
Yes. Choose °F as the temperature unit; 212 °F gives 138.506 Ω on a Pt100.
What is the resistance of a PT100 at −50 °C?
Look it up in the table or enter −50 in the tool; below 0 °C the extra C term of the Callendar–Van Dusen equation is applied automatically.
Related tools
- Thermocouple table: use this when your sensor is a thermocouple rather than an RTD.
- 4-20 mA calculator: use this to convert a 4-20 mA signal from a transmitter into a scaled value.
- IP rating chart: use this to check the ingress protection rating of an enclosure for a sensor installation.
- Resistor color code calculator: use this to read or check the value of a resistor from its color bands.
- PLC simulator: use this to test control logic that reads a temperature signal.
- All calculators: use this to browse every calculator on the site.